One trusted view of KPIs
We align definitions, owners, and data sources so teams stop debating numbers and start acting on them.
BI & Analytics
Build interactive dashboards, governed metrics, and self-service analytics that help leaders track performance and make faster decisions.
Overview
Sachak helps organizations move from scattered spreadsheets and manual reporting to trusted dashboards, consistent KPIs, and analytics experiences that serve executives, managers, and operational teams.
What We Solve
We align definitions, owners, and data sources so teams stop debating numbers and start acting on them.
Pages are designed around decisions, filters, drilldowns, and recurring workflows instead of chart decoration.
Recurring reports become automated, monitored, and connected to fresh data pipelines.
Delivery Blueprint
Clarify business questions, user groups, KPIs, workflows, and decision cadence.
Create consistent measures, dimensions, semantic logic, and governed datasets.
Build dashboards with hierarchy, comparison, drilldown, and exception handling.
Train users, document definitions, review adoption, and iterate with feedback.
Core Capabilities
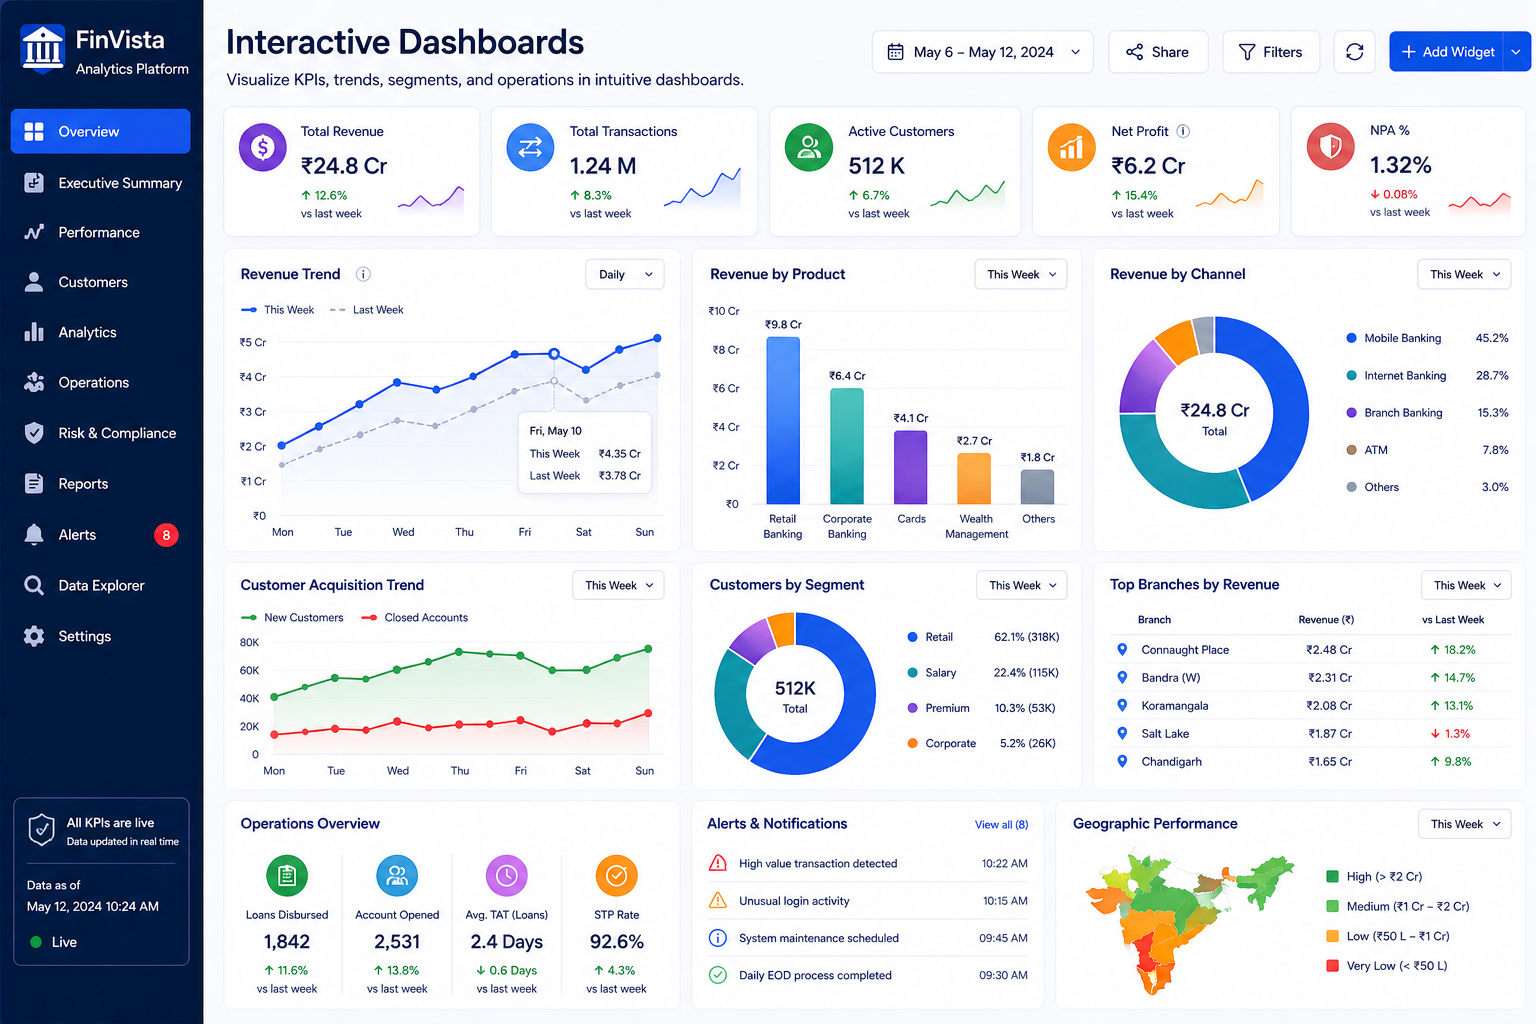
Visualize KPIs, trends, segments, and operations in intuitive dashboards.
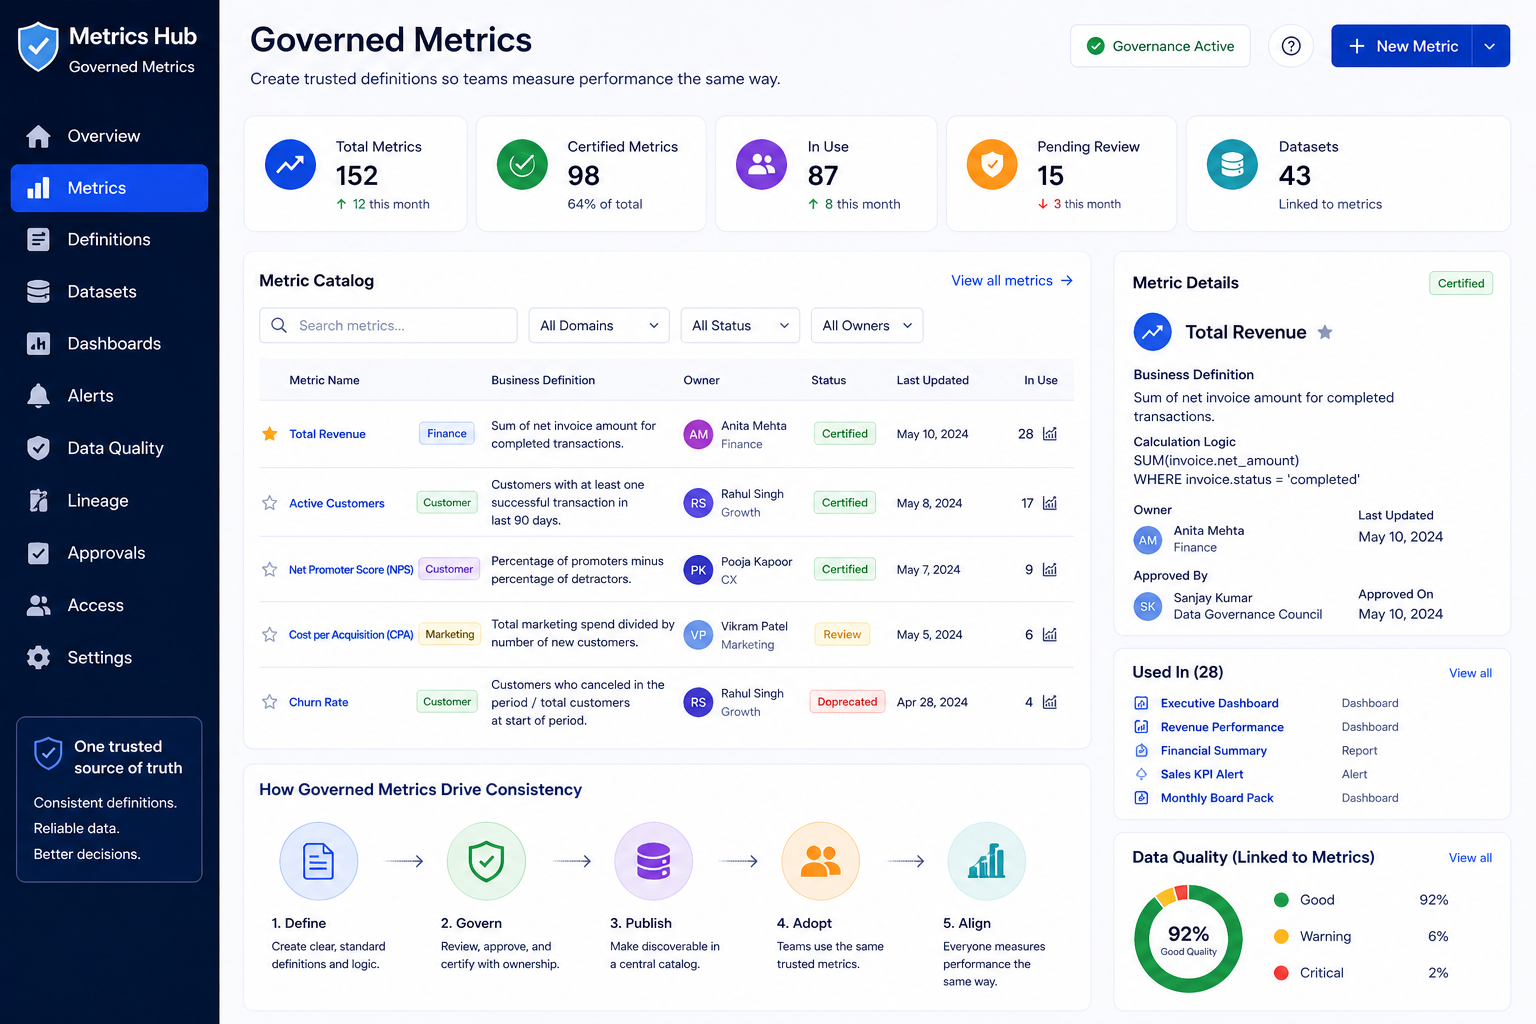
Create trusted definitions so teams measure performance the same way.
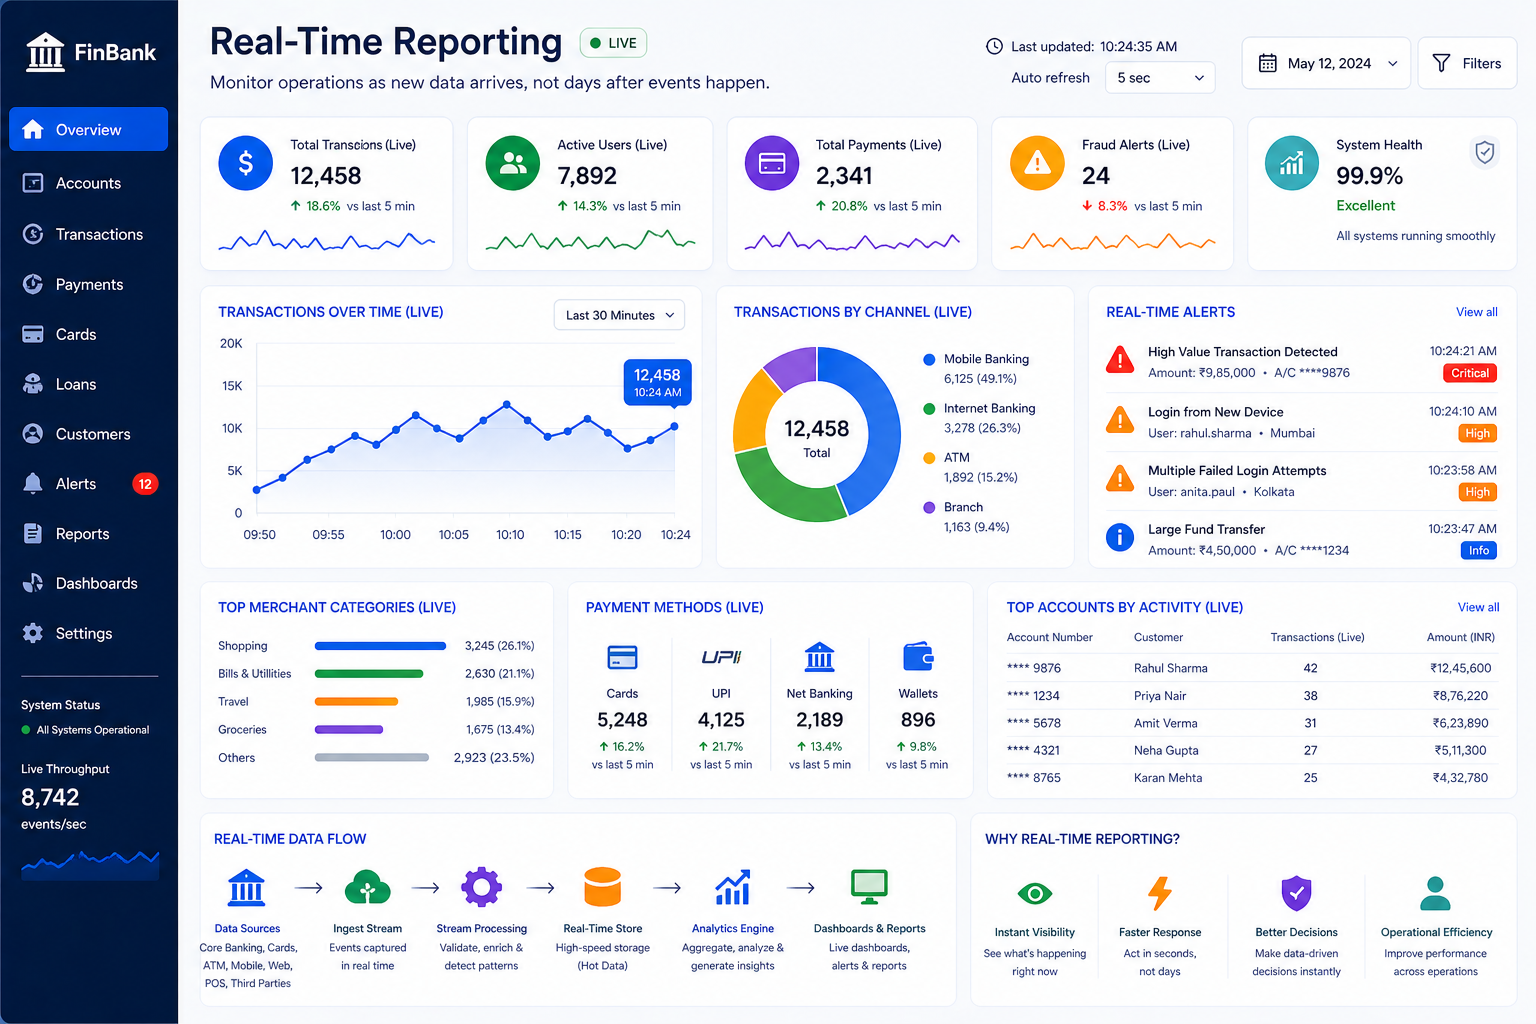
Monitor operations as new data arrives, not days after events happen.
Architecture
Workflow
Gather data from operational systems, databases, files, and applications.
Define metrics, dimensions, business logic, and reusable analytics datasets.
Create dashboards, reports, drilldowns, and executive performance views.
Use insights to improve operations, retention, revenue, cost, and strategy.
What You Receive
We deliver the dashboards, definitions, and operating rhythm that help teams make decisions with confidence.
Clear definitions, owners, source logic, and business context for important measures.
Executive, operational, and analytical views designed around actual workflows.
Checks that keep dashboards aligned with source systems and expected reporting logic.
Metric dictionary, dashboard notes, refresh rules, and practical usage guidance.
Solutions
Track strategic KPIs, growth, financial performance, and operational health.
Give teams governed exploration without waiting for every custom report.
Monitor service, sales, risk, inventory, delivery, and team performance.
Turn complex findings into clear narratives for leaders and stakeholders.
Expected Outcomes
Teams understand the numbers that matter and how they connect to goals.
Manual spreadsheet reporting and recurring ad-hoc report requests.
Dashboards tied to alerts, drilldowns, ownership, and next steps.
Shared source of truth for leadership, operations, and analytics teams.
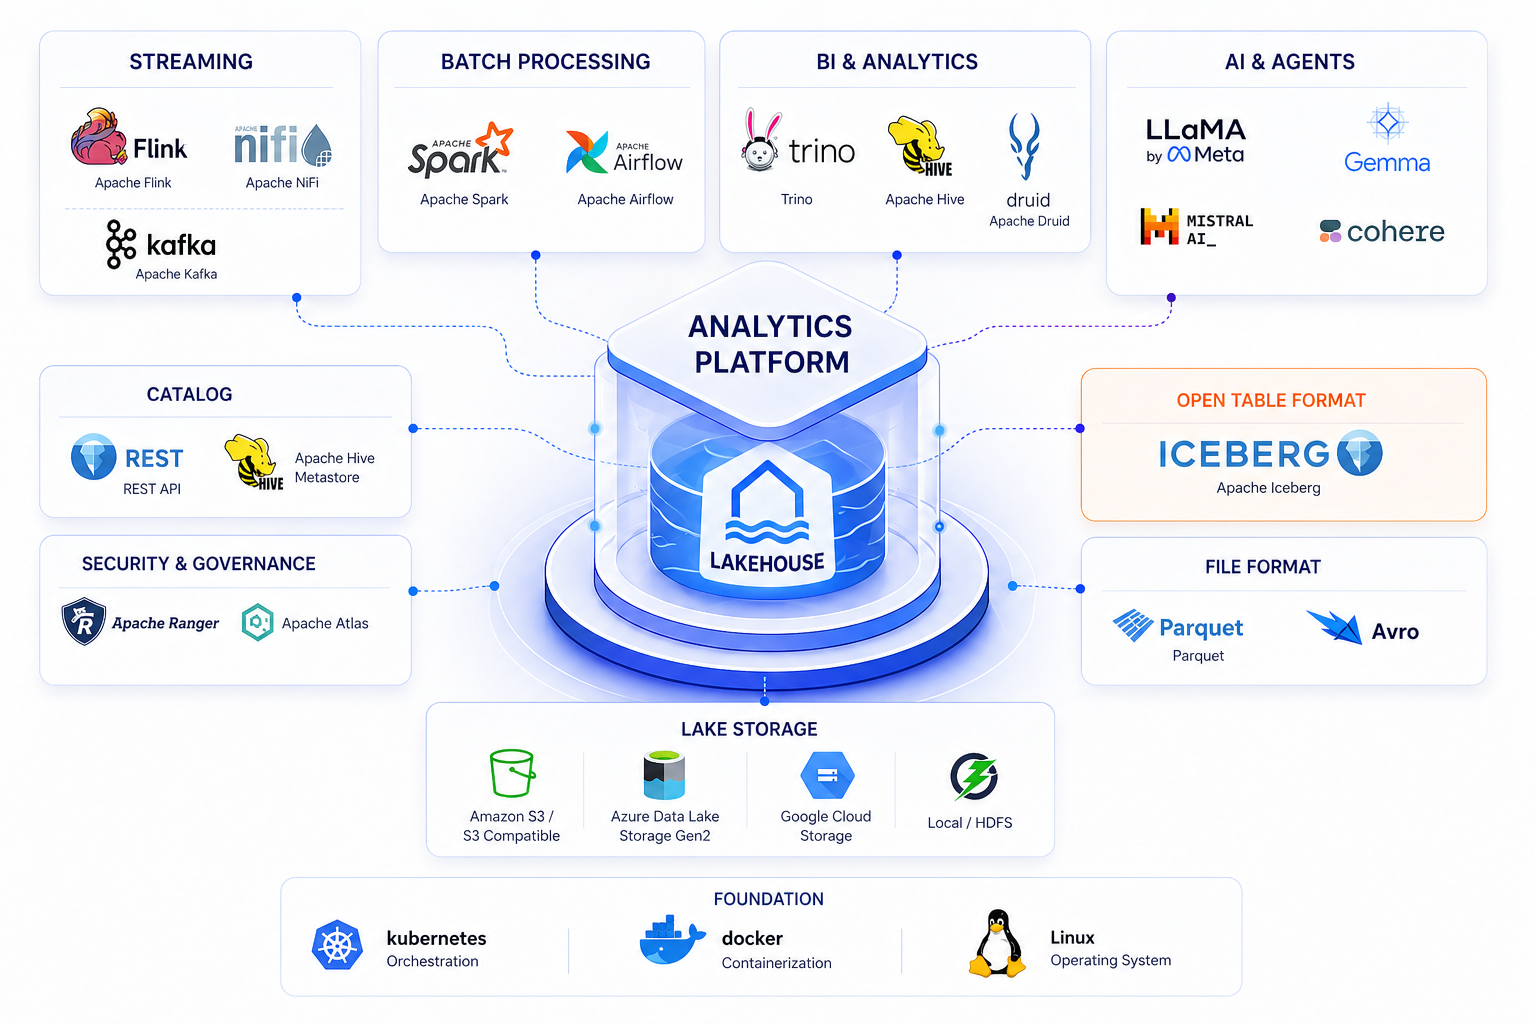
Technology Stack


